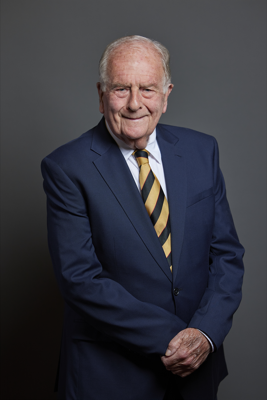
One of the longest-serving Conservatives in the Commons, Roger Gale has been loudest recently on a major infrastructure fight in his constituency. He has appeared at official planning hearings and co-signed a letter to the Examining Authority demanding withdrawal of the proposed Kent-Suffolk Sea Link — a subsea electricity cable project he argues would be a "carbuncle on the landscape." That campaign runs alongside consistent voting against the Labour government's major bills: he opposed the Railways Bill at Third Reading and voted against the mayoral elections order, while supporting opposition amendments to both the Railways Bill and the Steel Industry (Nationalisation) Bill.
Gale votes with his party 99.7% of the time — a near-perfect Conservative record — but his participation rate of 59% sits notably below the Commons average, which typically runs around 70--75%. He has one rebel vote on record, opposing Conservative support for the Windsor Framework's Northern Ireland pet travel rules alongside the TUV's Jim Allister. His speeches concentrate heavily on the economy, social care, local government and defence. His voting profile tracks orthodox Conservative positions — strongly anti-tax, pro-business, tough on crime — though he sits slightly above his party's average on Lords scrutiny, public ownership and welfare.
He has served in the Commons since 1983 and sits on the Panel of Chairs. Local news coverage — 44 articles in the past 90 days — clusters around crime, sport and health, with broadly neutral sentiment. The Sea Link opposition generates the most distinctive coverage linking him directly to a policy fight. Data on individual speech content is limited, so it is not always possible to assess the depth of his parliamentary contributions beyond topic-level summaries.